Why Track?
Ella's Story
An example person, who we'll call Ella, uses MoodTracker.com to track her anxiety levels over time.
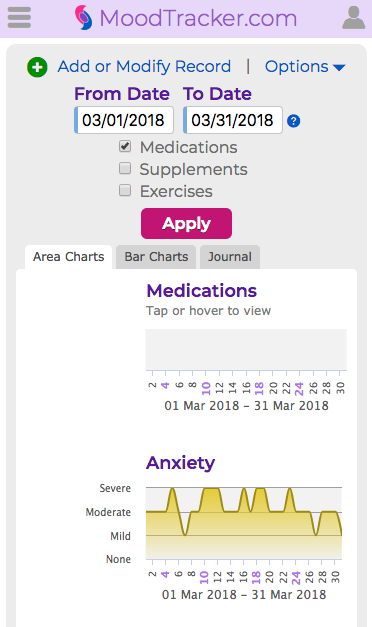
Chart - Month of March
Ella has been tracking her anxiety for several weeks. She's getting frustrated because her anxiety is impacting her work and relationships.
Ella has been tracking her anxiety for several weeks. She's getting frustrated because her anxiety is impacting her work and relationships.
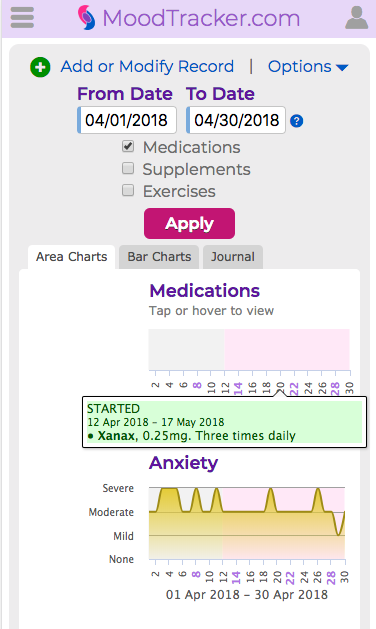
Chart - Month of April
Ella starts taking a prescription medication. When Ella taps on the pink bar she can see the medication and dosage. The pink bar shows the time on her calendar when this medication was active.
Ella starts taking a prescription medication. When Ella taps on the pink bar she can see the medication and dosage. The pink bar shows the time on her calendar when this medication was active.
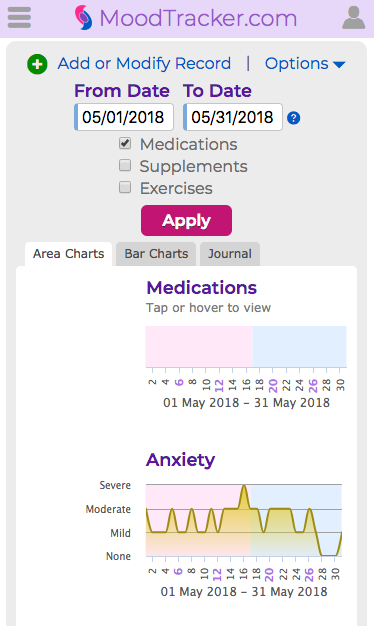
Chart - Month of May
Ella's Anxiety has improved a bit. She has fewer panic attacks and fewer episodes of severe anxiety, but her anxiety is still uncomfortable. She gets her medication adjusted slightly with a dosage increase. This change is indicated in the light blue area.
Ella's Anxiety has improved a bit. She has fewer panic attacks and fewer episodes of severe anxiety, but her anxiety is still uncomfortable. She gets her medication adjusted slightly with a dosage increase. This change is indicated in the light blue area.
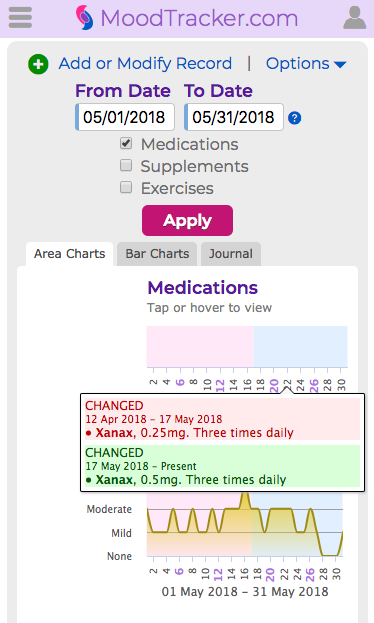
Chart - Month of May (continued)
When Ella taps on the blue area she can see when she stopped the old dosage indicated with the red color and she can see when her new dosage started indicated with the green color.
When Ella taps on the blue area she can see when she stopped the old dosage indicated with the red color and she can see when her new dosage started indicated with the green color.
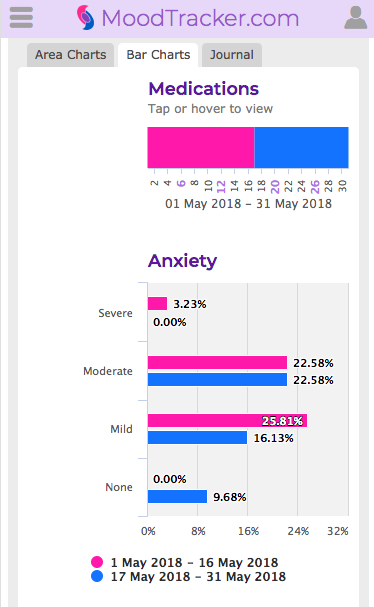
Bar Chart - Month of May
Ella wants to be more certain that the new dosage is helping her so she taps the Bar Charts tab to check her Anxiety levels during each medication change. The old dosage is shown in pink and the new dosage is shown in blue. There's no difference with her "Moderate" level, but she can see that she is reporting "None" more frequently with the new dosage. She also sees that she has not reported "Severe" since she started the new dosage. Ella is interested in seeing if this positive pattern continues.
Ella wants to be more certain that the new dosage is helping her so she taps the Bar Charts tab to check her Anxiety levels during each medication change. The old dosage is shown in pink and the new dosage is shown in blue. There's no difference with her "Moderate" level, but she can see that she is reporting "None" more frequently with the new dosage. She also sees that she has not reported "Severe" since she started the new dosage. Ella is interested in seeing if this positive pattern continues.
With a paid subscription you have the ability to track the effectiveness of your Medications, Exercises, and Supplements. The "Advanced" plan lets you track Medications and Exercises for $4.95 per month. The "Complete" plan lets you also include Supplement tracking for $9.95 per month.